
Open Street Map(ping)
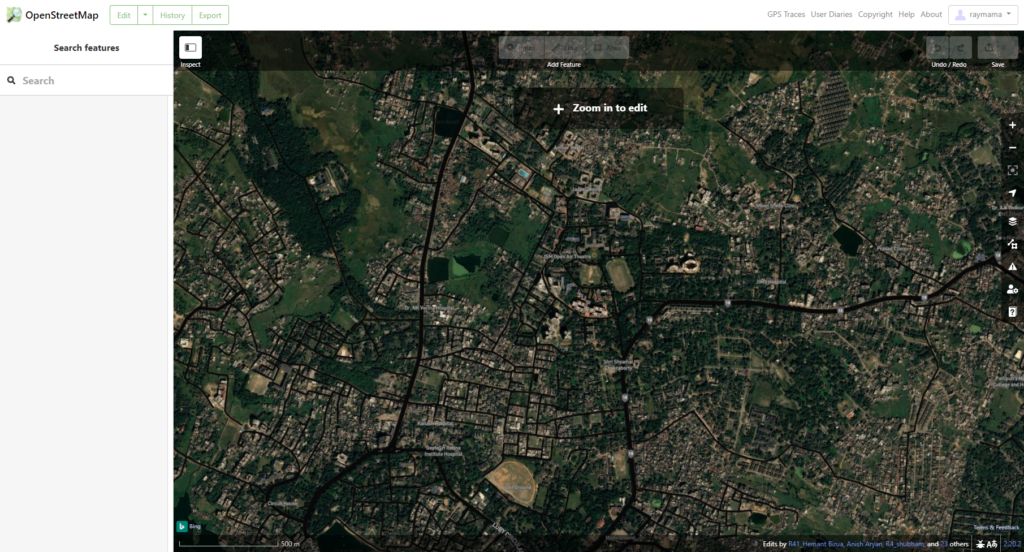
To mark the end of another experimental year, following is an account of first impressions of the OSM environment. A rudimentary understanding of digital cartography is helpful, however, armed with the descriptive notes, I believe the average reader will find it engaging as well. This in turn hopefully adds to the list of active OSM mappers, especially in India. Although a well-known and abundantly used platform around the world, India’s participation is somewhat limited. Its road data is extensive, but land-use demarcations and building footprints are sorely missing. Since it is openly sourced AND easy to use, most of us could consciously opt to contribute to the database. It does not take up a lot of time and third-party mobile applications for editing OSM, like Vespucci and StreetComplete, are readily available. On the go mapping may seem excessive for non-mappers but ensures correctness of data in lieu of very little effort. Although its uses range all the way from simple navigation to national humanitarian efforts, being from the construction industry myself, I find the repository extremely utilitarian when assessing neighbourhoods and settlement systems. To put it more accurately, I find the lack of data limiting during such studies. Government agencies are the largest singular source and there are visible efforts to digitize India’s socio-economic and geographic archives. With appropriate licenses in place, these could be shared on openly sourced platforms which, in my opinion, is the best route to expanding this database. The information may be exported from OSM in a variety of ways and could be used for anything from conceptual illustrations to building digital twins. The following article associates traditional mapping concepts and processes with the OSM ecosystem. It is also a reflection on the benefits of crowdsourcing GIS data and building a community around it. Our sample site here is the IIT (ISM) campus situated in Dhanbad, Jharkhand, India, primarily since it is well known to me. I trust the readership will find ample resources to navigate signing up, logging in, and reaching the OSM iD mapping interface (below).
Zooming in to an appropriate scale some of the main institute buildings can be seen marked. The geometry here does not neatly overlap with the satellite building footprint. Parallax may be the result of careless drafting or a different underlay. Choosing an appropriate image source with better positioning is a far more practical option than offsetting such a map. Existing features may be edited just as readily as new ones can be created. For the purposes of this article, I picked a comparatively unmarked area that happens to be predominantly residential. The default iD editor has been used for this run.
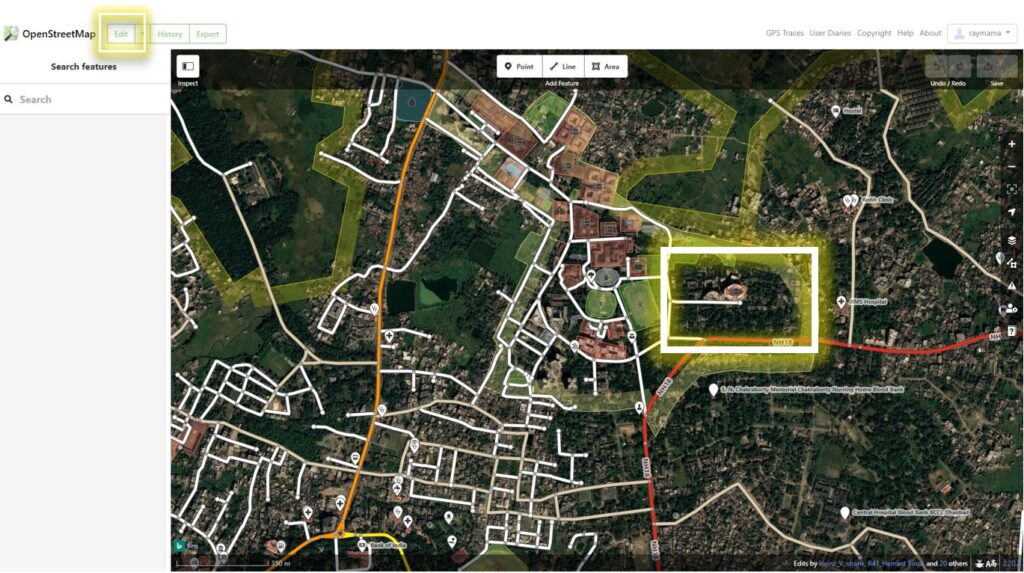
The three feature drawing options in the tools panel at the top mimic universal GIS. This is because of shapefiles (refer to the details panel if required). An appropriate type for each feature must therefore be selected.
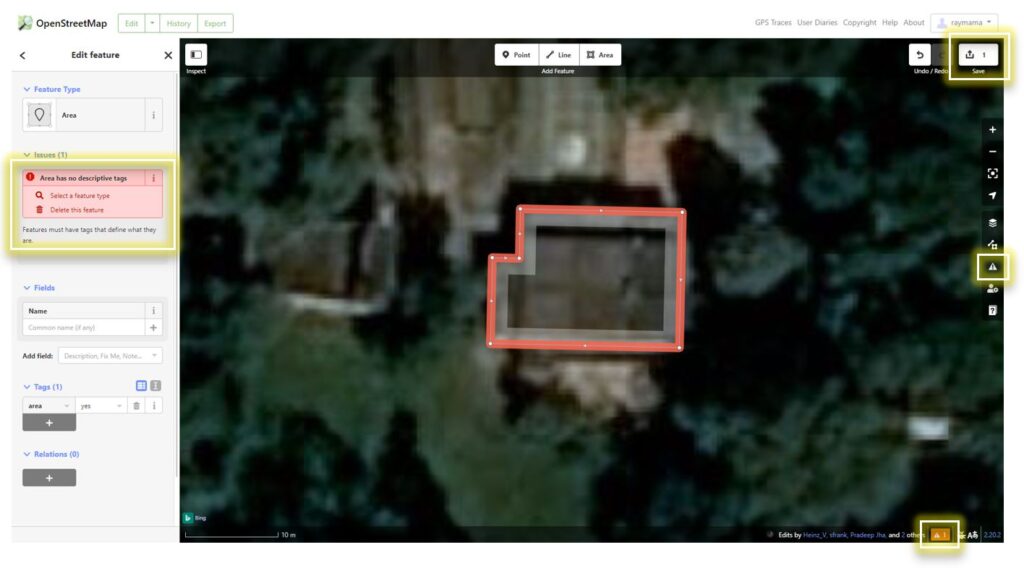
Having marked a feature, one can see the ‘Edit Feature’ panel pop up to the left which collects metadata associated with each geometry. This is the attribute table (more in the details panel) of the OSM ecosystem, albeit far more flexible, and is its MOST essential component.
The first section is Feature Type which specifies the land-use, building, or natural feature type of the selected element. The next, Issues, is temporary but highlights an important aspect associated with OSM mapping. Every feature needs to have a ‘type’. The default, ‘Area’, is only a placeholder and is not considered acceptable. There are three other sections, namely Fields, Tags, and Relations. Fields comes in a pre-set combination depending on the Feature Type selected. So a ‘House’ feature type will not have the same set of fields as say a ‘Pond’ feature type (duh I guess). This helps ensure relevant information is collected. There is also the option to add more fields, but this is left at the discretion of the mapper. Tags are listed automatically based on the data provided but more may be added independently. Relations is used to associate the feature with surrounding features and geography. This is important for setting up the local and regional context of every geometry. It also displays parent-child relations when working with multi-polygons. Together these sections describe the feature in question which enables it to be used in a variety of ways. A small warning notification in the information panel at the bottom shows how many features drawn by the mapper have a missing type field. The geometry also looks different which is helpful. The Edit Feature panel is almost the same for point and line features as well, albeit with contextual differences (much like that between fields and feature types).
Outlining and editing a few other features, I then proceeded to ‘save’ the changes made (button on the top right corner). Adding a changeset comment is the most important, and mandatory, part of upload. It is essentially a description of the work being published. Although any text fulfils the requirement, it is expected to add value to changes made such that users may understand the data better. There is also the option to open your edits for review. This selection cannot be changed once published and opting for it, more often than not, prolongs the time taken for updates to appear online.
Information may be exported directly from OpenStreetMap or downloaded via third-party applications that aim to supplement the dataset. There is a multiplicity of such platforms, each serving a different purpose, too diverse to be included in this discussion. Direct downloads give files with .osm extension. This filetype is coded in XML and is exclusive to OpenStreetMap. It cannot be opened as is which is why most third-party applications convert it to a more compatible format. The reason for its disparate nature lies in its origin. The filetype was developed with the express intent of distributing cartographic data over the internet whereas other traditional, and professional, mapping and assessment tools are founded on their ability to support queries. OSM has been around for a long time now and consequently multiple applications and plugins exist that seamlessly convert it for further use.
For those lost here, Open Street Map (OSM) is a collaborative cartographic geodatabase. One could think of it as an openly sourced web-based GIS (Geographic Information System) that records and displays feature information for all to see and use. Because of this feature-based information archival, its uses are far more varied than say something like google maps. OSM sources its metadata from registered mappers (account holders). Buildings and land-cover boundaries are individually drawn and associated information for each added along with. It is encouraged that mappers pick only such locations with which they are well acquainted so as to minimize faulty inputs however unintentional they may be. Personally sourced data is key. LearnOSM (https://learnosm.org/) is a wonderful repository that explains the essentials of working with OSM. Interested readers may look up this resource.
Vespucci is an android editor based on JOSM and published under the Apache license 2.0 (Free). It was the first OSM editor, released in 2009, and has been continuously developed and improved since. It is excellent for mobile updates and surveys. StreetComplete on the other hand supplements already mapped features by asking the public about it. Requiring significantly less involvement from the general population, it is easier to take on. Mapillary is another example of a third part application that archives geotagged images on an OSM map layer. Geotagging pictures only requires opting for it in the device settings.
OSM sports the same scale-based visibility as most cartographic tools (like google maps or QGIS), This is an essential parameter of all maps since not every feature is important at every scale. Building footprints are mostly useful at the hierarchy of neighbourhoods and that is the scale they become visible in. The same is true for continent, ocean, and city names, as well as road and building details.
The map panel to the right has a list of pre-set underlays. A more extensive version of this is available after logging in within the layers option of the panel. The list of background sources is concurrent with the organizations that are known to aid OSM.
The most basic, and de-facto, editor used for web based OSM mapping. It is an HTML5 application written by Mapbox,
Although JOSM is the more professional editor and offers greater flexibility, it is a little harder to navigate (or so I’ve heard). More on this once I’ve tried it.
A GIS feature has two basic components, a raster or vector base and associated attribute data. A shapefile carries vector geographic data but can hold only one type of feature at a time. This may be a node, a way, or a closed way marked as a point, a line, or a polygon respectively. The characteristic is native to the file type and can therefore be found uniformly across all mapping platforms that use vector features, This ranges from ESRI’s ArcGIS (who incidentally also coined the term) to web based applications such as Google’s Earth Engine and Big Query GIS.
The information panel is a good reflection of the extent of community participation in a given locale. Accounts involved in editing a given area are visible on it. This helps in potentially reaching out to relevant contributors in forums and for collective neighbourhood mapping.
A common term in the GIS environment, an attribute table holds metadata associated with a layer of geometry. Every layer has one feature type and a common set of attributes but can contain multiple geometries. This however is different from OSM in that the latter does not group in ‘layers’ and every piece of geometry is separate. It therefore also means that similar and even related geometries can have completely different set of attributes (fields).
We now know the importance of both the geometry and its attributes when building a cartographic database. It is advisable, but not mandatory, to fill these two simultaneously. Some may prefer to draw all geometries before filling in the metadata. A missing type is easily identifiable but the same is not true for other fields. A consistent workflow is therefore desirable.
The editor has a few checks in place that review a mapper’s edits. It is therefore easier to catch errors here than in most standalone applications. This is probably because of the different users each platform is designed for. Issues are aired by iD as Errors or Warnings. The rules for declaring erroneous mapping are listed in the Rules section of the Issues tab (Map Panel).
Forums put regular uploading time between a few minutes to several hours. My files have always taken about a day or so to come around.
Chances are, you’ve probably used applications that are based off of the OSM database. Some of the popular ones include Uber, Facebook, Craigslist, Trip Advisor, and Foursquare. Geodata services provided by the likes of ESRI, Mapbox, and Digital Globe are applied more directly by users of cartographic data. The downloaded .osm files can be put to use through remote applications like Sketchup and QGIS via plugins. The same is true for data extracted from the services mentioned above. Remote manipulation and assessment is crucial for valuable research.
State of the Map is an annual conference held by the OSM community. It has been going on since 2007, however, their youtube channel was started in 2016 and only since then have the proceedings been uploaded online. I am pretty sure not all of it can be found on the channel, but the discourse is very interesting if anyone feels like learning more about the field.